Last Tuesday, 24th October I did some sessions at EKON 21, one of which was on Creative Debugging Techniques. During the session there was a section where I was trying to demonstrate an idea or technique that happened to fully involve the CPU window. Unfortunately a series of finger fumbles on my part meant I couldn’t show what I wanted to show, albeit I think the point was made.
Anyway, I mentioned that maybe I’d write up that little snippet into a blog post, just to prove that it really does work as I suggested it does, and so here it is.
Oh, apologies up front for all the animated GIFs below- it seemed the most expeditious way to make sure I could really convey some of the points.
So the context was ‘What if?’ situations and testing out such scenarios during a debug session.
Clearly the primary tool for testing out ‘What if?’ scenarios is the Run, Evaluate/Modify… (Ctrl+F7) dialog. This dialog’s Modify button allows you to alter the value of the expression you have evaluated to find out how code behaves when the expression has a value other than what it actually had.
That’s a good and very valuable tool. But the case in point in the EKON 21 session was a bit different.
Consider a scenario where you are in the midst of a lengthy debug session, one that you’d really rather not reset and start again. Also consider that from some observations made in the debug session you have realised that a certain function B that is called from function A ought in fact not to be called. You want to test how well things pan out with B not being called.
In an entirely fabricated ultra-academic example, let’s use this code here, where A is TMainForm.WhatIfButtonClick and B is CommonRoutine.
procedure TMainForm.WhatIfButtonClick(Sender: TObject);

{$REGION '"What if?" scenarios'}

var
   S: string;

begin
   S := 'Hello world';
   Caption := S;
   CommonRoutine;
   Color := Random($1000000);
{$ENDREGION}

end;
One solution to this is to move the instruction pointer to skip the call to B just as B is about to be called. This can be done in a number of ways in Delphi. Set a breakpoint on the call to B and when it hits do one of the following four options to achieve this:
1) Set next statement menu item
Right-click on the statement that follows the call to B and select Debug, Set Next Statement, a menu item added in Delphi 2006 and described by Chris Hesik in this old 2007 blog post (from the Internet Archive WayBack Machine).
2) Drag the instruction pointer editor gutter icon
Drag the instruction pointer icon in the editor gutter to point at the following statement. This drag and drop support for the instruction pointer symbol was added in Delphi 2010.
3) Change the instruction pointer in the CPU window
Invoke the CPU window (View, Debug Windows, CPU Windows, Entire CPU or Ctrl+Alt+C), or at the very least the Disassembly pane (View, Debug Windows, CPU Windows, Disassembly or Ctrl+Alt+D). Right click on the next statement and choose New EIP (or Ctrl+N).
4) Update the EIP register in the CPU window
Invoke the CPU window (View, Debug Windows, CPU Windows, Entire CPU or Ctrl+Alt+C). Note the address of the instruction you want to execute next. Right-click the EIP register in the Registers pane and choose Change Register… (Ctrl+H) and enter the new value as a hexadecimal number, i.e. with a $ prefix. An alternative to Change Register… is to choose Increment Register (Ctrl+I) a sufficient number of times to get the value to match the target address.
OK, so all of those achieve the goal on that single invocation of routine A, but what about the case where A is called lots of times – lots and lots of times? This idea falls down in that situation and so we might seek out an alternative option.
Maybe we can get rid of the call to B entirely for this run of the executable. Yes, maybe we can and indeed that was just the very technique I tried to show, but made a couple of silly mistakes by not paying attention to what exactly was on the screen. Mea culpa.
There are a couple of approaches to getting rid of the call to B from the code present in A. One is to replace the first few bytes of that statement with an instruction that jumps to the next statement. The other is to replace the entire statement with opcodes corresponding to ‘no operation’, i.e. the no-op opcode NOP. Let’s look at both approaches.
Both these approaches involve changing existing machine instructions in memory. With that end goal comes a rule, and the rule is that you can’t successfully change a machine instruction that your program is currently stopped at in the debugger or that the debugger has a breakpoint on. In other words, if you want to change the call to CommonRoutine to be something else this must be done when the program is stopped at a different instruction in the debugger and there must be no breakpoint on that instruction.
This is simply a side effect of the way debuggers implement breakpoints and statement stepping - they replace the first byte of the instruction to break at with $CC, the byte value, or opcode, for the assembly instruction INT 3. When execution continues the $CC is swapped back for the original value.
So if you change the instruction at the current EIP when the execution has stopped in the debugger, when you ask it to move on your first byte will get replaced, just by the mechanics of your debugger doing its day job. This will most likely cause a very much unwanted opcode combination leading quickly to an application crash. [ One of my EKON fumbles was to instantly forget this previously well known (by me) fact and promptly get a crashed debuggee. ]
Your best bet is to put a breakpoint on the preceding instruction, and then modify/replace your target instruction. Make sure there is no breakpoint on the target instruction.
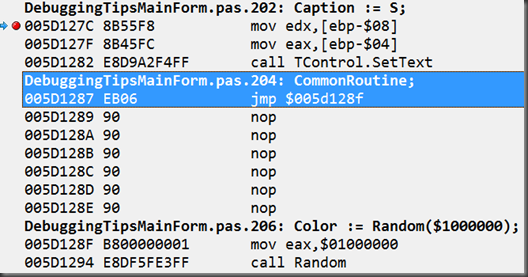
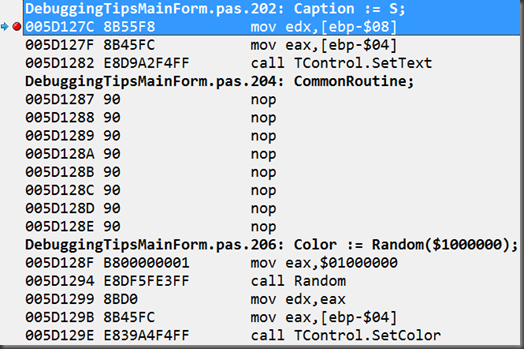
When you look in the CPU window you can see the assembly instructions that correspond to the Pascal statement above it.
In the case of the call to CommonRoutine the assembly code is:
mov eax,[ebp-$04]
call TMainForm.CommonRoutine
The machine code bytes (opcodes) that represent those 2 instructions are $8B, $45, $FC and $E8, $11, $F8, $FF, $FF respectively. The 3 bytes for the first instruction are stored at locations starting at $5D1287 and the 5 bytes for the second instruction start at $5D128A.
The statement following the call to CommonRoutine starts at address $5D128F, 8 bytes on from $5D1287.
1) Overwriting an instruction with a jump instruction
The goal is to write some opcodes into memory starting at address $5D1287 that represent an assembly instruction to jump 8 bytes forward. If we look at the documentation for the x86 JMP instruction, a small jump is 2 bytes of instructions encoded as $EB coupled with the jump distance from the end of the jump instruction. So 8 bytes minus the 2 byte instruction is 6, so $EB $06. [ One of my fumbles in the EKON session was to misread the $EB as $E8, which is a CALL opcode. ]
So, to change the current code for new instructions we have to move our attention away from the Disassembly pane to the Memory pane. You can either use the one embedded into the Entire CPU view or open up one of four standalone memory panes using an item from the submenu View, Debug Windows, CPU Windows:
- Memory 1 (Ctrl+Alt+E)
- Memory 2 (Ctrl+Alt+2)
- Memory 3 (Ctrl+Alt+3)
- Memory 4 (Ctrl+Alt+4)
By default the memory pane will be settled on address $401000, the start of the application’s Code segment (according to first piece of information in a detailed .map file, as generated by the linker).
You should reposition to the target instruction by using Go to Address… (Ctrl+G) from the context menu and entering (in this examples case) $5D1287. You’ll see the ‘familiar’ 8 bytes we saw for the instructions right there on the first line:
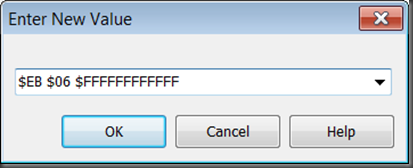
To change these 6 bytes to be bytes representing our jump instruction you can select Change (Ctrl+H) from the context menu and enter the values: $EB $06.
You can also simply start typing those values directly into the Memory pane and the Enter New Value dialog will pop up.
This changes the first 2 bytes of that instruction and the Disassembly pane echoes this by showing the JMP instruction.
As you’ll note, however, there is a bit of “noise” after this for the remaining 6 opcodes: some junk that is jumped over.
[ Update 30/10/2017 – thanks to The Arioch for welcome interjections. It should be noted that in this case after trampling over the first 2 opcodes the remainder of the previous set of opcodes still “make sense” to the disassembler. So much so that the very next Delphi statement is still shown and is still translated directly into its constituent opcodes.
It is, however, often the case that having bulldozed over a couple of essentially arbitrary opcodes, what’s left is a bit of a mess, and puts things “out of kilter”, leaving subsequent Delphi statements not showing in the disassembly pane thanks to what opcodes have come before.
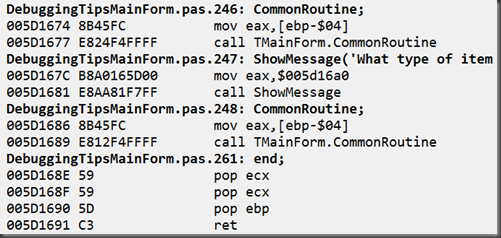
As a simple example, not necessarily demonstrating the ultimate confusion that can be caused, here’s some code:
If we wish to skip the ShowMessage call we need to workout the JMP opcodes.
Run a copy of Windows Calculator, go into programmer mode (Alt+3), and calculate $5D1686 – $5D167C to get the gap from ShowMessage to the following statement. Then subtract 2 to take off the size of the small JMP instruction. This gives a final result of 8, so we enter new opcodes of $EB $08 and what’s then showing in the disassembly pane is this:
The disassembly of the call to CommonRoutine has gone rather up the spout, even though the opcodes for it are actually still quite intact.
End of update ]
To clean this up we could fill in the remaining 6 bytes with opcode $90, which corresponds to NOP, the assembly no-op instruction:
This shows as:
[ Another of my EKON fumbles was to enter too many $90 bytes having miscounted the required bytes, or perhaps forgetting that I need to subtracted the size of the jump instruction. This rather messed up the following instruction, which should have been left intact. This got another crash. ]
Or you could fill with data byte $FF – just data:
2) Overwriting an instruction with NOP opcodes
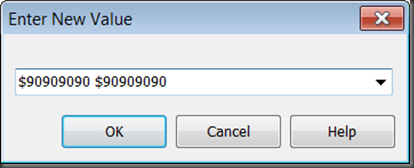
This is just an extension of the last points in the option above. In a memory pane that has been located on the start of the target instruction, just change all the bytes of the instruction to the NOP opcode, $90. We have 8 bytes here, so use the Change submenu item (Ctrl+H):
There we go, that’s what I meant to show in that 5 minute section of the session – apologies for the poor demonstration but hopefully this makes up for it ¯\_(ツ)_/¯





Great post! If I ever get a working debugger (I'm using C++ Builder) I'll surely use some of this.
ReplyDeleteWhat is up with your debugger, Mike?
Delete> To change these 8 bytes .... values: $EB $08.
ReplyDelete06 not 08
You clearly forgot to account for the 2 bytes of the instruction itself
And that is how JMP is a bad option
You have to make a fine arithmetics with huge chance to miscalculate or mistype. And even after you did - you still have to enter lots of NOPs (or $$FF) just to make that place standing out, make it both clearly visible and not deranging the disassembler.
But if you still go into those NOPs, if you still have to add them after your JMP SHORT - then use Occam razor and skip JMP entirely.
PS. ...and good luck with it on LLVM targets :-D
Re the 6 vs 8 - thanks for that. As you may have guessed I'd started with a larger instruction and thought I'd changed all the references. Will fix.
DeleteThe typical magic constant problem. And since you cannot have named constants in the debugger - i'd think twice and thrice before engaging into ad hoc JMP jockeying.
DeleteFrankly, you do a degraded example in the code you patch. That is a lucky case where $FC happens to be a one-byte command CLD, so the disasm gets back in sync very fast and it all seems easy-peasy.
DeleteI'd suggests introducing patching some more rich code, so that the post-JMP bytes would form rather different opcodes, and to display how it runs disasm window off the rails across Delphi source lines.
Then it would became evident why you suggest right-padding with $FF or $90
>>The typical magic constant problem.
DeleteI'm not sure about a magic constant issue. That's me changing my mind, getting it working and forgetting to change all the text in a descriptive blog post.
>>And since you cannot have named constants in the debugger - i'd think twice and thrice before engaging into ad hoc JMP jockeying.
I'm quite happy with this as an avenue to achieve a certain goal under certain conditions. Thanks for expressing your concerns, though.
>>Frankly, you do a degraded example in the code you patch. That is a lucky case where $FC happens to be a one-byte command CLD, so the disasm gets back in sync very fast and it all seems easy-peasy.
DeleteSteady on now. This isn't an all-encompassing article covering the subject; it's just a simple example of a possible technique to employ.
That said, I take your point that in this case the following instructions didn't get bulldozed. Maybe I'll add in an update to show such an example just to show the "risks" without the NOPs.
>>Then it would became evident why you suggest right-padding with $FF or $90
Well, I still maintain that clearing out the noise of irrelevant instructions is a good enough reason. However in the case of run-on instruction trampling, it becomes a more self-evident case.
>>and good luck with it on LLVM targets :-D
DeleteYeah, this is more for testing logic on Win32, maybe Win64 (not sure offhand)
Next lesson should be about replacing one function call with another function. In-memory patching :-D The one hugely used to fix RTL bugs that EMBT did not.
ReplyDeleteWell, that would indeed be an interesting topic to follow on with. I'll see how I get on with time windows for such fun things. Thanks for the idea!
DeleteAnd yeah, the requirement: the programmer SHOULD understand assembler, so he should see if the given assembler code does indeed represent his Delphi code, or not.
ReplyDeleteCause i saw debugger glitches after which...
XE2: the line numbers in debug information did not matched real RTL/VCL line numbers (default state in XE2 update 4)
10.1: the visible code was not the real one, debugger itself altered the code with stealth instrumentation, the real code was visible in Memory Pane but was concealed and substituted with expected code in Disasm window.
Granted, this latter case was during debugging the RTL patching, and th programmer managed to run two IDEs in parallel, so the debugger just could not tell which IDE sends which commands. Understandable in retrospect, but quite confusing when suddenly hit you over the head.
In both those cases thoughtless patching the code with JMPs or NOPs "because that was said in that blog" would lead to a rather random program destruction.
>>10.1: the visible code was not the real one, debugger itself altered the code with stealth instrumentation, the real code was visible in Memory Pane but was concealed and substituted with expected code in Disasm window.
DeleteIs this written up anywhere? I haven't noticed this behaviour.
>>In both those cases thoughtless patching the code with JMPs or NOPs "because that was said in that blog" would lead to a rather random program destruction.
You pays your money, you takes your choice. Just ideas, just things to try. Things that have helped me out.