As it happens I've been part of the Delphi world for around 26 years now, as I used to work at Borland and was involved with testing and experimenting with and working with the pre-release versions.
What can I say other than Happy Birthday, Delphi? You've been a good friend to me over this last quarter of a century and I've been happy to be part of your world.
Some number of posts ago I wrote up 10 Tips for Delphi Users. When I checked I was horrified to find this was 7 years ago! (My, my, how time flies when you're having fun...) Anyway, I thought I'd take that list and build upon it, expanding it up to 25 tips for Delphi users, which is what we have here. So without further ado let's get straight into the list.
1) Running apps from network shares
Sometimes people like to put executables on network drives and run them from there – it allows potentially many users to launch a single executable. However if the program is running and the network connection breaks there is a more than reasonable chance that the program will crash is a quite ghastly manner, understandably enough.
Given users are at liberty to launch there apps like this it may be an idea to make habit a simple step that alleviates the aforementioned crash scenario. You can have the Delphi linker set a special bit in a 32-bit Windows executable header to instruct Windows that in the event of being launched off a network drive the executable should first be copied to the local paging file and then be launched from there. This flag was introduced in Windows NT 4.0 and described in this old Microsoft Systems Journal article (recorded for posterity in the Internet Wayback machine now Microsoft has droped all its old MSJ content) by Matt Pietrek from 1996.
This is quite straightforward. You can do this with a compiler directive in the project file or you can change the linker setting (at least in recent versions of Delphi).
To change the project file, you must make sure that Windows (or Winapi.Windows, if you prefer) is in the
uses clause and then add in this compiler directive after the uses clause:{$SetPEFlags IMAGE_FILE_NET_RUN_FROM_SWAP}
To set the linker option directly, open the project options dialog (
Ctrl+Shift+F11), go to the Linking options, ensure you are looking at options for a 32-bit build configuration and then give a value of 2048 to the Set extra PE Header flags option. This is passed along to the compiler as the --peflags:2048 command-line switch and does the same thing.You could work out the value to pass along yourself by looking in Winapi.Windows.pas and seeing that
IMAGE_FILE_NET_RUN_FROM_SWAP has a value of $800, which in decimal in 2048.To clarify some points that have come up in comments, this linker setting does not affect operation of the program in terms of how .ini files shipped alongside the .exe get loaded or what the value is returned by
Application.ExeName.2) Getting the type of an object when you only have its address
If we just have the address of an object, say in a pointer, how do we get its type? Well, we simply cast the address to a
TObject and call its ClassName method. You can do the exercise in a Watch expression (Ctrl+F5) with the address directly, so long as you remember to allow side effects and function calls when adding it.
For bonus points you can identify the type in the CPU window’s memory pane rather than the Watch List window. Invoke the CPU window with
Ctrl+Alt+C and pay attention just to the memory pane at the bottom left. In recent IDEs you can also just invoke a solitary memory pane using View, Debug Windows, CPU Windows, Memory 1 (Ctrl+Alt+E) or Memory 2 (Ctrl+Alt+2) or Memory 3 (Ctrl+Alt+3) or Memory 4 (Ctrl+Alt+4).In the memory pane, firstly have the memory displayed in 8 byte chunks of data by right-clicking and choosing Display As, DWords.
Now right-click again and choose Go to address… (
Ctrl+G) and enter a suitable expression based on the pointer value or object address. For this example let's say the object address is $27E2C20. This is an object reference – the address of an object’s instance data. So if we de-reference the pointer we’ll be at the start of the instance data. But the address of the class name string is a little way into the instance data, a distance given by the constant vmtClassName, so the required expression will be:PInteger($27E2C20)^+vmtClassName

As mentioned, we’re now looking at the address of the class name, which is stored as a short string. To follow (de-reference) this address, right-click on it and choose Follow, Offset to Data or press
Ctrl+D. This takes us to the information we seek: TFoo.
If you wish you can change the display back to bytes (right click, Display As, Bytes) and then the short string is more obvious – you can see the length prefix byte for the 4 character string is indeed 4.

3) Inspecting an item in a TList
The old
TList class is still a useful beast, even if in many cases we should be using the newer generic TList. TList is useful when the list will potentially contain objects of different types, with suitable backup code that knows to check the type and cast appropriately.In the debugger, if you want to inspect an item in a
TList things can be a bit of a challenge. When you inspect your TList variable (Alt+F5) you get a debug inspector that hints at the items contained therein in its FList field.
If you right-click on
FList and choose Descend (or Ctrl+D, to make this inspector inspect that field) or Inspect (or Ctrl+I, to launch a new inspector showing that field) you’ll see the addresses of the items in the list.
These aren’t much use though; being as this is the type-unsafe general
TList these values are just pointers. Indeed if you look in the definition of TList you’ll see this FList field is a TPointerList – an array of pointers.So what do we do to inspect the item underlying a pointer variable? Well, we cast the pointer to the right type and inspect that. To work out what type that is, as Tip 2 above suggests, we cast the address shown in the inspector to a
TObject and call its ClassName method.This tells you the type. Now you can bring up an inspector for the currently unhelpful pointer by selecting it in the inspector and pressing
Ctrl+I, or maybe just double-clicking it.
Then you can apply the typecast by right-clicking and choosing Type Cast... or pressing
Ctrl+T, and entering the target type of TFoo (in this example’s case). And then you have what you sought:
4) Loop failure iteration detection
You’ve doubtless encountered this scenario while debugging. There’s an issue in a loop. The loop executes *loads* of times but you need to look into the problem so you need to know how many times round the loop the problem occurs. Stepping through the loop, or using a breakpoint and pressing
F9 or clicking on the last line of the loop and pressing F4, counting in your head – all such options are mind-numbing and hugely prone to losing count or messing up in some regard, so how about letting the system work it out for you?Place a breakpoint at the end of the loop with a massive pass count – say 1000000. Now run the app and make the problem occur. Now look in the breakpoints window and check the current pass count – it will tell you how many times the breakpoint has been passed without actually breaking.
Once you know how many iterations it has been through, modify the properties of the breakpoint and set the pass count to that value. Restart the program and the when the breakpoint triggers the error will occur on the next iteration of the loop. Nice!
5) Breakpoint logging
Breakpoints had their advanced properties added many, many versions ago. You can use advanced breakpoint properties for a variety of cunning debugging scenarios, but a simple usage is to enable cheap logging without writing additional code statements.
Wherever you want to log some information, add a breakpoint and bring up the breakpoint properties. Press the Advanced button, set the breakpoint to not actually break and then specify the log message. For bonus points you can also choose to have an expression evaluated and (optionally) logged at the same time.

This log information will be added to the Event Log window during your debug session in the same way that
OutputDebugString messages are, but with the benefit of not having written any code. If you have the IDE set to save your project desktop then the breakpoints will be saved when you close the project and reappear next time you open it.6) Leaving RTL assembler code
When stepping through code with Debug DCUs enabled you often inadvertently end up in RTL assembly code. In most instances
Shift+F8 (Run, Run Until Return) will run the rest of the code through and take you back to where you were so you can try F7 again.Shift+F8 doesn’t always work. For example if you use F7 on a call to a dynamic method you end up in the System unit’s _CallDynaInst routine. This doesn’t exit in the normal manner, but by jumping off to the located method address stored in the ESI register.
The best way forward here is to click on the
JMP ESI line, press F4 to run up to that point and then press F7 – that will take you into the dynamic method that was called.7) Find declaration while debugging
Seasoned Delphi developers know that you can locate the definition of a symbol by right-clicking it in the editor and choosing Find Declaration. Rather annoyingly there is no shortcut listed next to it, but it is commonly known that if you hold down
Ctrl and wave your mouse around the editor, anything that the IDE thinks it can locate the definition/declaration of turns into a hyperlink – this Ctrl+click hyperlink feature is Code Browsing and links to the Code Browsing History keystrokes of Alt+← and Alt+→ that allow you to go back and forth though the links you’ve clicked.The problem with
Ctrl+click is that it doesn’t work in a debug session. Many times it would be handy to find the definition of a symbol in a debug session but Ctrl+click just doesn’t cut it. Fortunately, however, Alt+↑ *does* work in a debug session (yay!)… (or at least should do – it generally does for me). Why Alt+↑ isn’t listed in the editor context menu against Find Declaration baffles me. It’s a very little-known but useful shortcut.8) Non-destructively locally disable a compiler option
Often-times a build configuration has range-checking enabled to ensure problems show up when they occur as tangible issues rather than vague Access Violations through memory overwrites way down the line during an execution. That said, it can still be important to selectively turn off range-checking for specific small sections of code that are valid, but will flag up range-check errors thanks to, say, the pointer types involved.
Clearly you can turn range-checking (or overflow-checking or whatever) off and on using local compiler directives, as in:
{$R-}
//code that requires range-checking off
{$R+}
but what about if you then build the code with a build configuration that has range-checking globally disabled? This use of compiler directives means the file in question will have range-checking *enabled* from that point onwards, despite the intent being to have it disabled throughout the project.
This is where this tip comes in. You can selectively change a compiler option using code like this, where this example disables range-checking if it was enabled, and then ensures it gets enabled again if appropriate:
{$IFOPT R+}
  {$DEFINE RANGE_CHECKING_WAS_ON}
  {$R-}
{$ENDIF}
//code that requires range-checking to be disabled
{$IFDEF RANGE_CHECKING_WAS_ON}
  {$R+}
{$ENDIF}
Here we define a conditional symbol if we toggle range-checking off, and we use that symbol’s existence to decide whether to enable range-checking later.
9) Building a Delphi project at the command-line
For quite a few versions now, Delphi has used the MSBuild format for its project files and project group files. This means you can use MSBuild to build your projects and project groups, using appropriate MSBuild command-lines to pass in options or specify build targets (the targets include
clean, make and build). So if you have a project Foo.dproj and you want to clean up the previously produced binaries (compiled units and executable output) and then build it in Release and Debug configurations for Win32 and Win64 you could run these commands in a RAD Studio Command Prompt:msbuild -t:clean -p:Config=Debug -p:Platform=Win32 Foo.dproj msbuild -t:build -p:Config=Debug -p:Platform=Win32 Foo.dproj msbuild -t:clean -p:Config=Release -p:Platform=Win32 Foo.dproj msbuild -t:build -p:Config=Release -p:Platform=Win32 Foo.dproj msbuild -t:clean -p:Config=Debug -p:Platform=Win64 Foo.dproj msbuild -t:build -p:Config=Debug -p:Platform=Win64 Foo.dproj msbuild -t:clean -p:Config=Release -p:Platform=Win64 Foo.dproj msbuild -t:build -p:Config=Release -p:Platform=Win64 Foo.dproj
See also my post on building, installing and launching an Android app from the command line for additional Android-specific details.
10) Formatting entire projects
Recent versions of Delphi have offered pretty printing, as it used to be called, or source formatting as the process is now described. It’s invoked by Edit, Format Source (or
Ctrl+D) and can be fully customised in the Tools, Options dialog. Your custom settings can be saved into formatter profile files.It’s less well known that the formatter is also available through a command-line tool. You can use this to run it across all files in a project directory tree.
Assuming you’ve saved your custom IDE formatter options in a formatter profile called Formatter_MyProfile.config then you start by running up a RAD Studio Command Prompt. Now issue some commands along these lines and it’s all done for you:
set CONFIG="Formatter_MyProfile.config"
set LOG=Format.log
del %LOG%
formatter -delphi -config %CONFIG% -r –d . > %LOG%
11) Case toggle
If you are not a touch typist and occasionally type a whole bunch of code in with CAPS LOCK on you should become familiar with the keystroke that toggles the case of a marked block:
Ctrl+O, U.12) Disable Error Insight to lower blood pressure
I’ve said this before in talks and in writing. I’m very happy to say it again. Please, *please*, don’t suffer the shame of Error Insight and its hopeless and hapless efforts in working out what might compile and what might not. Yes, it gets the simple ones right. But any vaguely interesting project that you work within is pretty much guaranteed to be besmirched with lots of red squiggles over perfectly good code and perfectly locatable units in the uses clause all within a fully compilable code base. The fact that Error Insight continues to be enabled by default, despite the growing problem of its inaccurate problem detection is really rather surprising. I urge you to disable Error Insight by going to Tools, Options… and then locating the Code Insight options within the User Interface and then Editor nodes on the tree of categories on the left.
Yes, yes, there are reasons why it gets it wrong – it’s not using the exact same parsing code as the compiler does and doesn’t know all the things that the compiler does. But this has been the case for years, and it still offends my eyes with its tenacity of squiggling over code that has just compiled cleanly.
Ease your annoyance at Error Insight by turning it off. Then pick any of the plethora of Error Insight bugs logged on the Quality Portal and vote for it/them.
One day, maybe one day soon, Error Insight will function again and will a useful programming ally. But until then it deserves no place in any self-respecting programmer's IDE.
Seriously though, on very large projects, disabling anything that executes and isn’t useful/productive is a benefit. When working with clients’ large projects I disable Error Insight, Tooltip Help Insight and automatic Code Completion.
13) IDE Insight shorter shortcut
A great IDE navigation feature called IDE Insight was introduced in RAD Studio 2010. It was inspired by the ability to search for things in Windows by pressing the Start button and simply typing what you wanted.
In the IDE there is similar functionality to find any window, option, preference, file (recent or current), project (recent or current), form, property, menu command, new item, desktop, code template or component (if the form designer is active). IDE Insight is commonly invoked by
Ctrl+. (Ctrl and period), indeed that keystroke was introduced in that feature introduction post linked above. Note that rather than popping up in a separate window as it did when introduced, IDE Insight now manifests as a drop down list from an edit field embedded in the RAD Studio caption bar.However as a means of saving 50% of the keys required to trigger IDE Insight I'd like to ensure you know that
F6 does the same thing - it also fires IDE Insight. So there we have a productivity improvement in accessing a productivity improvement :)
14) Synchronising declaration and implementation
When RAD Studio 10 Seattle brought some of the Castalia features on-board into the IDE I missed a really useful one for a couple of years. It is common to implement a routine, e.g. declaring a method with its parameter list in a class definition and implementing it in the implementation section of the unit. Furthermore it is not uncommon to realise you need slightly different parameters in the parameter list.
Having 2 parameter lists to edit is a bit of a bind. Or at least it used to be! This is what the new(-ish) feature called Sync Prototypes is for. As soon as you update one of the routine signatures (or its prototype) then you simply invoke Sync prototypes with
Ctrl+Shift+Alt+P and the other one will be updated to match. It doesn't matter whether you edit the one in the interface section or the one in the implementation section - Ctrl+Shift+Alt+P will update the other.15) Hiding non-visual components
One drawback of Delphi's form designer is that both visual components and non-visual components are placed on the form's UI area. The problem is that as you start using more and more non-visual components in the designer (and don't elect to partition them off onto non-visual data modules) it becomes harder and harder to see the underlying UI of the form.
At last we have a means to mitigate this glaring issue. Another feature added by RAD Studio 10 Seattle was the option to Hide Non-Visual Components, which can be triggered on the form designer using the
Ctrl+H shortcut. You can also find the option in the menu and context menu, on one of the toolbars and, for good measure, in the Tools, Options... dialog - see the docwiki page for details.16) Working out from where a message box was called
The following scenario might be a rarity for you, but for me it happens surprisingly frequently.
While debugging an application a message box pops up and I need to know its provenance - where in the code was it invoked from? Searching the code base for the message string might work, but the message may be dynamically constructed so it's certainly not a given that would work. I tend to use the following technique to help me get to the point of origin.
First of all pause the application with the Run, Program Pause menu item or equivalent toolbutton.
At this point you might think the call stack would help out but alas not. As we see here the call stack is barren:

However the crucial piece of information here is that the debugger is looking at the wrong thread in terms of what we are interested in. If you switch to the Threads window (
Ctrl+Alt+T) you can see that the active thread in terms of what the debugger is looking at is the last one in the list.
This thread is of no interest to us. We need the main thread, the UI thread, which is the first in the list. Double-click on that first thread and the call stack is immediately replete with lots of entries:

If you scan down from the top you will start to see entries suspiciously looking related to message box work and eventually (and hopefully) you come to entries related to your code. In the case below the first entry in "user code" (my code) is
TForm2.Five. If you double-click that entry you will be taken to the relevant code, with the editor highlighting the point we will return to (after the invocation) in red (by default), Sure enough the red line is just after my call to ShowMessage.
17) Listing out DLL exports
When you need to find what routines are exported from a DLL you can use the TDump.exe utility, or alternatively TDump64.exe. Either work fine in producing a lot of information on an executable file, .exe or .dll. To just list out the PE exports use the -ee command line switch, e.g.

If you are working with Android apps and want to get the exported symbols from a .so library file then TDump et al fall short. However you will already have the NDK installed with comes with a lot of Linux-y utilities that can do this sort of thing.
Assuming you set an environment variable
NDK_ROOT to point at your Android NDK folder and then set another variable NDK_TOOLS to be the subfolder of NDK_ROOT's value containing all the pre-built tools that work on Android binaries then we can run some vaguely concise commands.Incidentally, once in a command prompt these commands (with path modified to suit your installation) will set up the variables as described:
set NDK_ROOT=%PUBLIC%\Documents\Embarcadero\Studio\20.0\PlatformSDKs\android-ndk-r17b
set NDK_TOOLS=%NDK_ROOT%\toolchains\arm-linux-androideabi-4.9\prebuilt\windows\bin
nm is a utility to list file symbols, objdump is a utility to dump information from various types of object (binary) files and readelf is a utility to dump information about ELF files (ELF being the format for executables in Unix-land, the Executable and Linkable Format). To invoke these utilities and get the exported symbols from a .so file we can use any of these commands:
%NDK_TOOLS%\arm-linux-androideabi-nm.exe -gD libandroid.so%NDK_TOOLS%\arm-linux-androideabi-objdump.exe -T libAndroid.so%NDK_TOOLS%\arm-linux-androideabi-readelf.exe -W --dyn-syms libAndroid.so


18) Save additional global desktops for better working arrangements
RAD Studio ships with 4 Desktops to work with, with one set to become active in a debug session (Debug Layout). Normal editing starts in the Default Layout and those who yearn for days gone by can choose Classic Undocked to make the IDE look a little bit like Delphi 7.
The Startup Layout is a nice option to switch to as a convenient way to undock all the tool windows taking up most of the editor space: Object Inspector, Structure, Project Manager and Tool Palette. With those shrunk down to the edges of the main window you can see much more of your code lines.

This tip is really just to make sure you know you can lay out the IDE windows any way you like and save new Desktops. For example for developing you might want to undock the Object Inspector, Structure pane, Project Manager and Tool Palette, position them on your second monitor, thereby having a near full-screen editor but still having the other tool windows available. You might also want the Message window (View, Tool Windows, Messages or
Shift+Alt+M) visible but shrunk back to the bottom of the editor.Whatever your preferred window layout you can organise things as you like and then save it as a new Desktop to select as and when you choose:

19) Better editor font
RAD Studio still installs with Courier New as its default editor font.

That's a bit "old hat" these days so here are a few options that don't cost anything. Choose your favourite!
Since Windows Vista we have a nicer monospaced IDE-friendly font called Consolas built right into Windows:

For a longstanding programmer's font you could try Source Code Pro:

If you want something more tailored to modern IDEs then you could try Hack:

Alternatively a new player in the field is JetBrains Mono:

20) Alternate IDE profiles
Sometimes I feel the IDE is way too big and full of stuff I have no interest in. But I don't want to disable anything just in case. Under these circumstances we do have the option to set up a whole new IDE profile within the registry that we can use to play and experiment with cutting down the 'bloat' in the IDE, and also to set various different default options that we might want to try.
The IDE supports various command-line switches as documented in the docwiki. When you run RAD Studio no command-line switches are used. If you have the full RAD Studio then your Start menu group for RAD Studio will contain a Delphi shortcut and a C++Builder shortcut. These pass a personality command-line switch, either
-pDelphi or -pCBuilder, when starting bds.exe.Another command-line switch that we can use to specify a registry profile is
-r. If I set up a shortcut to start bds.exe with a -r TinyBDS command-line switch (or run it from a command prompt with that switch) then it will not use the default HKEY_CURRENT_USER\Software\Embarcadero\BDS\20.0 registry path but instead will use HKEY_CURRENT_USER\Software\Embarcadero\TinyBDS\20.0, creating the new profile with a full set of defaults if necessary.Now, to remove 'bloat' we pick and choose IDE packages that we feel aren't giving us what we want and disable them. How do we do that? Well the IDE packages are all listed in this registry key (for my sample
TinyBDS registry profile): HKEY_CURRENT_USER\Software\Embarcadero\TinyBDS\20.0\Known IDE Packages. There is also a subkey for the Delphi personality and a subkey for the C++Builder personality.To disable a package we either move the entry from this Known IDE Packages key and move it into the sibling
Disabled IDE Packages key, or we edit the package description and prefix it with an underscore. Either way it's a bit fiddly, so why don't we find a tool to help us?In Code Central there is just such a tool, uploaded by the ever helpful Ray Vecchio. Download this IDE ad-in package source code, start up your IDE in the experimental registry profile, open the package, compile and install it.
Now make sure you really started the IDE to use the new, experimental, expendable registry profile before you go and mess up your normal, default installation profile. Don't say I didn't warn you!
To use the add-in choose Tools, Options... and select Third Party, Package Editor, Packages. Now you can go to the tabs labelled Known IDE Packages\Delphi and Known IDE Packages and check all the packages you feel like disabling. When you are done press Save, exit the IDE and restart it against the same registry profile. If you've been too gung go the IDE might not start, in which case you'll need to try again with another registry profile.
While testing this out to slim down my current Win32/64-targeting and VCL-only IDE I disabled these packages in Known IDE Packages\Delphi:
- delphifmxmobile260.bpl
- delphifmxide260.bpl
- delphierrorinsite260.bpl - this one goes back to Tip 12 (see above)
- delphiandroidservices260.bpl
and these in Known Packages:
- gdbdebugcore260.bpl
- gdbdebugide260.bpl
- ios32debugide260.bpl
- ios64debugide260.bpl
- tgide260.bpl
- DeviceManager260.bpl
- GuidedTour260.bpl
- MultiDevicePreview260.bpl
- LivePreview260.bpl
- MirrorHub260.bpl
- android64debugide260.bpl
- androiddebugide260.bpl
- delphiandroid260.bpl
It may be that I can also remove some of the profile and SDK related packages, I haven't tried yet. What I do know is that when I start Delphi now (
bds.exe -pDelphi -r TinyBDS) it feels much quicker :)21) Switch to FastMM4 for additional features
Long ago when Delphi 2006 came out the original Delphi memory manager was retired and replaced with the open source FastMM, written by Pierre Le Riche. Well, to be precise it was replaced with a cut down version of FastMM, the current version of which is FastMM4.
FastMM improves upon the abilities of the original Delphi memory manager in typical application scenarios does a great job. That is, assuming you are looking at a Win32 or Win64 application - FastMM is used for Win32 and Win64. For other platforms the underlying POSIX memory manager is used.
If it turns out your application has specific requirements that make FastMM not behave as well as you'd like there are other memory managers out there that target specific usage scenarios; go and search them out.
One of the benefits offered by FastMM is it includes the ability to spot when your application has leaked memory and can tell you on exit, and this is enabled by assigning True to the
ReportMemoryLeaksOnShutdown System unit variable. Once you've done this (as the first statement in your project file code block) any leaks get reported thus:
This is good inasmuch as you know you have one or more memory leaks, but then leaves you high and dry. Where are they?!
Fortunately the full version of FastMM improves things greatly on this score. If you download the full FastMM4 and add the FastMM4 unit as the first unit used in your project file and re-run you now get this message:

Open FastMM4's FastMM4Options.inc file and locate the comment that says Option Grouping you can see where various symbols can be defined for Release and for Debug builds. In the Debug build section ensure that
FullDebugMode and EnableMemoryLeakReporting are defined. Now make sure the FastMM_FullDebugMode.dll file is available in the folder your Debug build executable is created into and re-run. On exit it now says:
If you locate that specified file and open it you will see similar information to what was on the message box:

If you scroll further up the file you will see more detailed information about each leak, for example the string list leak is announced like this, complete with a call stack:

This now arms us with much more information that we had with the default version of FastMM used by Delphi so we can head directly to the source of the leak and fix it.
The full FastMM also offers options for detecting heap corruption, interface misuse and more besides. Do yourself a favour and start using it if you haven't already done so.
Note that what we are looking at here are handy benefits of the full version of the default memory manager. There are other leak detection tools and utilities that offer more than we get with FastMM4. I hope to look at one or two of them in the near future, but in the mean time reap the rewards of FastMM4.
Useful links in the docwiki include:
22) Rebuild RTL source
If you need to make a tweak to a VCL or FMX file, this is feasible and (in some senses) reasonably common. You either copy that file, or maybe the whole VCL or FMX source directory (C:\Program Files (x86)\Embarcadero\Studio\20.0\source\vcl or C:\Program Files (x86)\Embarcadero\Studio\20.0\source\fmx) to somewhere else, add that location to your project source path, make your tweaks and rebuild.
Rebuilding the RTL is slightly trickier due to the System.pas unit being something of a 'special case'. If you want to rebuild the Win32 or Win64 RTL, or even the OSX RTL then there is a build batch file supplied in the RAD Studio installation that can assist.
As before copy the RTL folder, C:\Program Files (x86)\Embarcadero\Studio\20.0\source\rtl, to somewhere else and make your tweaks. Then start a RAD Studio Command Prompt, use
CD to navigate to that RTL copy folder and run buildrtl.bat passing it a debug or a release command line parameter. If you want to build the RTL in a regular command prompt rather than a RAD Studio command prompt then modify where the batch file goes looking for RSVars.bat, which it calls if it can find it, to set the same environment variables up.I'll leave you there to pore over the contents of the batch file, which seems to be a little out of date now we have support for rather more platforms than Win32, Win64 and OSX, but it may be of use.
23) Rebuild RTL Android Java source
Deeper down that the Pascal RTL source files, on occasion intrepid Android developers need to tweak the Java files that underlie RAD Studio's FireMonkey foundations. Sometimes a bug needs fixing, or an extension needs to be added to the raw GireMonkey Android activity to achieve a certain goal.
Rebuilding those Java files can be done, but it's not necessarily obvious how to do it. This is why I went through the whole process recently in a dedicated post: Rebuilding the Delphi & C++Builder Android Java files. If you ever need to change the Java files you now know where to go for instructions on how to do it.
24) RTL Easter Eggs
When you have had a hard day's programming and are looking for a little light relief, try perusing through the RTL, VCL and FMX source code seeing what you can find. As the ex-Borland R&D wizard Danny Thorpe used to say: "Use The Source, Luke". Sometimes you'll learn of new features and functions. Other times you might happen upon something that prompts a wry smile. Here are a couple of examples.
Have you encountered the
EProgrammerNotFound exception class type, defined in System.SysUtils? I think I will be using that from time to time in the future.Also, the
TDeviceClass enumerated type in System.Devices.pas, which as well as sensible members such as Phone, Tablet and Watch also has some more interesting members: Elf (no relation to the ELF Unix executable file format), Dwarf and Wizard as explained in the docwiki:
25) IDE Easter Egg
Invoke the About box with Help, About..., then hold down
Alt whilst typing TEAM. This produces a scrolling team list of members of the development team. You can also hold Alt+KUDOS for a list of those who have contributed to the product: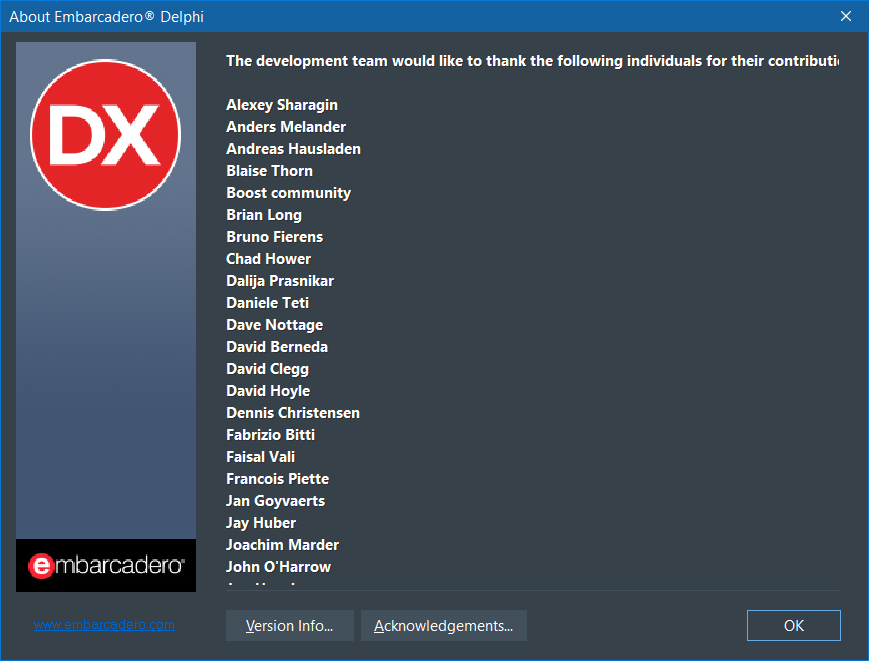
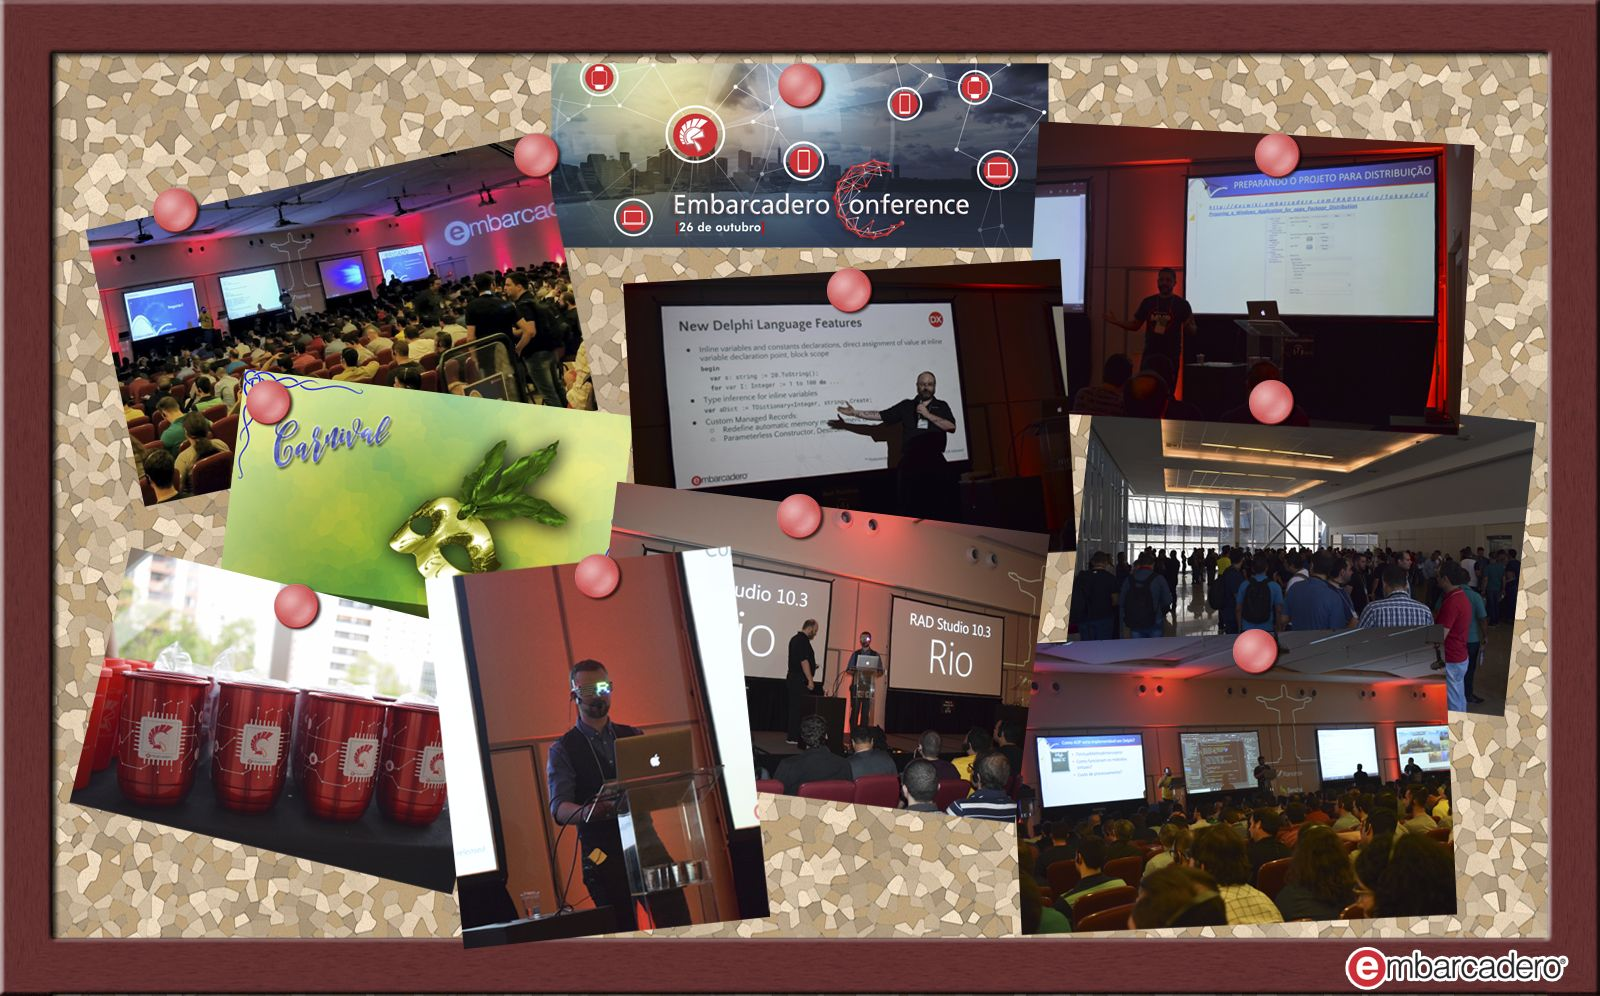
Double-click on any name in the development team list and you get some team pictures:
Alt and type GUNGLA you get to see Tequila Joe Monkey on a surfboard:

And why is this? Well, who knows? But a little monkey business is a good way to wrap this post up.
Nice post, thanks :)
ReplyDeleteGlad you enjoyed it! (o:
Delete