Thursday, 17 October 2013

My CodeRage session files

At the time of writing my two sessions for CodeRage 8 are being broadcast around the Arpanet.

I’ve got two session this year, both related to Delphi mobile development, and both concerning how to reach out from the island that is the FM Application Framework (aka FMX aka FireMonkey) and gain access to the underlying mobile OS platform APIs.

The first session is Accessing the iOS API and looks at how Delphi-written iOS apps can talk to the CocoaTouch APIs and access additional iOS frameworks. We look at the Objective-C bridge and see how it is used to import iOS APIs, namely classes and protocols (Apple’s term for what we call interfaces), and how you can implement iOS interfaces and inherit from iOS classes. We also briefly look at how to pull in APIs that are not already imported by Delphi’s RTL. As a proof of concept we briefly see a Delphi iOS app that has no FMX code or units in it whatsoever, operating purely through the iOS APIs using the standard CocoaTouch model.


Files from the Accessing the iOS API session can be downloaded from here.

The second session is Accessing the Android API and looks at how Delphi-written Android apps can talk to the Android SDK classes. We look at the Java bridge and see how it is used to import Android APIs. We’ll also look at how to pull in APIs that are not already imported by Delphi’s RTL. We also look at how to add a splash screen to an Android app to cover up the startup time on anything other than the fastest devices, how to add Android menus to an app and how to launch external activities and get results back from them.


Files from the Accessing the Android API session can be downloaded from here. Take note that since several of the samples involve various required preliminary steps in order to function, as they step outside the comfort zone of Delphi XE5 RTM’s Android support, you should check the ReadMe.txt files supplied in the project directories of those projects.

[Update]

I plan to write up some of the subjects covered by these demos in further posts or articles as time and work schedules permit. However in the mean time I’ll respond to comments by expanding this post as necessary.

It appears that when the small Java source files get compiled, the Android dx tool expects them to be compiled by the JDK 1.6.x compiler as opposed to the JDK 1.7.x compiler. If you have JDK 1.7.x installed, you hit a problem with dx reporting:

bad class file magic (cafebabe) or version (0033.0000)

However, to avoid forcing a reinstall of JDK 1.6 you might like to modify my build.bat batch files and add in extra command line switches to the javac.exe command-lines. You need to insert this after the javac.exe command to force Java 1.6 byte code output, which is digestible by the Android dx command:

-source 1.6 -target 1.6

[Update 2]

Current write-ups:
  • Splash screens are written up here for Delphi XE5 and Delphi XE6.
  • Launching activities and getting results back is written up here for Delphi XE5 and Delphi XE6.

Thursday, 26 September 2013

Nostalgia. Is it just a thing of the past?

I was put onto this treasure trove of old scanned manuals the other day: http://bitsavers.informatik.uni-stuttgart.de/pdf/borland. It contains a huge directory hierarchy of PDF scans of old product manuals from all sorts of vendors. And that’s scans of the whole manuals, not just the front covers.

Want to brush up on your Turbo Pascal 7 language? Or review the details of the Turbo Pascal Graphix Toolbox (all the Turbo Pascal manuals are here, while Turbo C manuals are here and Borland C++ manuals are here)? Or recollect the specific of Sidekick Plus (Sidekick manuals are here)? Or be reminded how Turbo Prolog worked (Turbo Prolog manuals are here)?

Turbo Pascal Reference Manual

All this and more are there as PDFs. And not just old Borland manuals. Oh no, browse up the directory tree and you can find oodles of stuff on say, the Apple Lisa (Apple’s manuals start here and the Lisa manuals are here).

What a great resource for those who like to look back from time to time :o)

ObjectVision Reerence Manual

Take a browse through and see how many product manuals you’ve forgotten all about.

Turbo C User's Guide

Ahhh, product manuals. Those were the days!

Oh, and while on the subject of manuals, back in the day the Borland documentation team did like to have a bit of fun in their work. The Delphi 1 manuals contained a couple of Easter Eggs.

Friday, 20 September 2013

Android resources

For those Pascal programmers looking at building Android applications, be it with Delphi XE5 or with Oxygene for Java (I work with both!), here are a few Android-related resources that may come in useful:

  • Google’s Android Device Manager – if you mislay your Android device this allows you to locate it on a map (if it’s got a data/WiFi connection) and also ring it (presumably if it’s a telephone – I haven’t checked whether this option does anything on a tablet). Clearly this is similar to Apple’s Find My iPhone functionality.
    [Update: Jim confirms that tablets will happily ring too]
  • Using remote Android emulators – because Android emulators emulate the device CPU they can be hideously slow, and basically unusable in a VM. If your dev tool runs in a VM then it can be useful to communicate to an Android emulator (technically called an Android Virtual Device or AVD) either on the host machine or another machine on your network. This is a useful technique entirely independent of your chosen development tool as it revolves around how your local adb.exe communicates with the emulator. This post by Jim McKeeth runs through how to set this up using SSH. You can also find a write-up in the Delphi online documentation.
  • If you are using Oxygene for your Android development you may want to look at setting up your AVD to use an x86 CPU, potentially taking advantage of Intel Virtualization Technology via Intel HAXM (Hardware Accelerated Execution Manager) to provide VM acceleration. Delphi developers cannot take advantage of this because Delphi targets the ARMv7 CPU.
  • App testing across many devices. The Android emulator has long been held up as pretty much the only way of testing your app across the range of form factors that different devices can offer. Now it’s not the only option though, as Apkudo for Developers offers developers a free online app-testing platform where your app will be tested on over 260 different Android devices. Just upload your app to the queue and a report will be sent back when the tests have been run.
  • Since Android’s Ice Cream Sandwich release introduced the Roboto font as the default, you may want a copy to install on your machines. You can download it from the link in the blue box here (or this is the direct d/l link).
  • Google’s sample icons pack can be downloaded with this link.
  • For anyone who does presenting it can be very useful to have a means of showing on your computer screen what your device is doing. There are various VNC-based solutions for this out there, but Jim McKeeth has built a simple solution using repeated screen-captures called Android Screen View. You can download the source code for it here or pull down a build here.
  • The Android dashboards show you the percentage of devices sharing various characteristics as obtained from the Google Play store. All the devices in question will be running Android 2.2 (FroYo) and above.
    This device breakdown can be useful to decide what OS and form factor to ensure you support.
    On the dashboards you can see the breakdown of:
    • Android OS versions
    • Screen sizes and densities
    • OpenGL version
  • If you have a nose that needs to be poked inside everything, consider pulling down the Android source code. Information on how is available here.

Thursday, 19 September 2013

Where has all the colour gone?

Once upon a time there was colour and interest a-plenty in development tool splash screens. Well, this was certainly the case with Delphi and C++Builder anyway.

And then corporate America took over and things dulled down with an unmistakable business-like tone.

Take a look through the progression of splash screen I have here and see if nostalgia strikes.

1997: Delphi 3

Delphi 3

1998: C++Builder 3

BCB3Splash

1998: Delphi 4

Delphi4Splash

1999: C++Builder 4

BCB4Splash

1999: Delphi 5

Delphi5Splash

2000: C++Builder 5

BCB5Splash

2000: JBuilder 4

JBuilder4

2001: Delphi 6

Delphi6Splash

2002: Delphi 7

Delphi7Splash

2004: Delphi 2005

Delphi2005

2005: Delphi 2006

Delphi2006

2007: Delphi 2007

Delphi2007

2007: C++Builder 2007

CBuilder2007

2008: Delphi 2009

Delphi2009

2008: C++Builder 2009

BCB2009

2009: Delphi 2010

Delphi2010

2010: Delphi XE

DelphiXE

2011: Delphi/RAD Studio XE2

DelphiXE2

2012: Delphi/RAD Studio XE3

DelphiXE3

2013 – Delphi XE4

DelphiXE4

2013 – Delphi XE5

DelphiXE5

Delphi supports iOS 7

Good to see prompt Delphi support for iOS 7, as reported by Embo’s Sarina DuPont. It’s out and available for download from the registered users site a mere 1 day after iOS 7 was released.

Documentation for the new support is on the docwiki.

I can’t help noticing, though, that it appears to be an XE5-only update. This is not good news for those still beavering away with iOS code in XE4.

I’m sure I remember hearing talk of support for iOS 7 shortly after iOS 7’s release for XE4 iOS programmers.

Let’s hope there’s an XE4 update to follow real soon, otherwise this will throw another bone of contention into the mix, and the blogosphere will once again be alight…..

Wednesday, 11 September 2013

Delphi for Android (aka Delphi XE5 aka RAD Studio XE5) has appeared

Delphi Android dude

Blimey, that took me by surprise (again)! I figured it was coming fairly soon, but I didn’t realise quite that soon.

Anyway, Delphi XE5 is here (as is RAD Studio XE5 and siblings), as Tim Del Chiaro on his Delphi Insider blog.

The Trial Edition is up and available for download and those with Software Assurance should have access to the full version.

You can get a run down of what’s new in the XE5 doc wiki – specifically the What’s New page, but there’s also a general What’s New page. However the thrust of this release is all about adding Android to the portfolio of supported target platforms, with the suggestion that you can get applications compiling for both iOS and Android from a single source base.

But before getting bogged down in Android it’s worth mentioning these new features:

  • the REST client library, a new cross-platform framework for easy access of REST-based web services
  • REST debugger
  • the full integration of FireDAC
  • IDE support for MacinCloud
  • Extendible IDE mobile design devices
  • the awesome IDE Insight functionality (Ctrl+. or F6) is no longer a modal dialog but is now a search box
  • style support for the freshly released iOS 7
  • swipe to delete feature on mobile platforms
  • TListView search filtering support
  • the removal of the long defunct WebSnap and InternetExpress (with the suggestion to use IntraWeb and WebBroker instead for similar functionality)

Also there have been a bunch of iOS fixes along the way, as you’d expect.

The full Delphi range of platform targets now covers:

  • 32-bit Windows
  • 64-bit Windows
  • 32-bit OS X
  • iOS Simulator (Intel)
  • iOS (ARM)
  • Android (ARM)

This is achieved with this half dozen compilers:

  • dcc32 – Embarcadero Delphi for Win32 compiler version 26.0 – your regular Win32 Delphi, the latest version updated over many versions since Delphi 2
  • dcc64 – Embarcadero Delphi for Win64 compiler version 26.0 – the 64-bit Windows targeting compiler
  • dccosx – Embarcadero Delphi for Mac OS X compiler version 26.0 – the Delphi compiler that generates 32-bit OS X apps
  • dccios32 – Embarcadero Delphi Next Generation for iPhone Simulator compiler version 26.0 – the NextGen Delphi compiler that builds Intel executables that run in the iOS simulator
  • dcciosarm - Embarcadero Delphi Next Generation for iPhone compiler version 26.0 – the NextGen Delphi compiler that builds ARM executables that run on iOS devices
  • dccaarm – Embarcadero Delphi for Android compiler version 26.0 – the NextGen Delphi compiler that builds ARM executables that run on Android emulators and devices

Android requirements

Because the Delphi compiler generates native machine instructions, its output is processor-specific. In other words it doesn’t target the Dalvik Virtual Machine, where regular Android applications reside, which are basically Java p-code applications that are executed by a variant of the Java VM. Instead it generates raw machine code, as all the current wave of Delphi compilers do (the long gone Delphi for .NET was the exception to this general rule). So because it’ a compiler compiling native machine instructions Delphi’s Android support has the following requirements:

  • there must be a GPU
  • the CPU must be ARMv7 with NEON instruction support
  • the OS on the target device must be one of:
    • GingerBread: Android 2.3.3+ (MR1 or later), which is API level 10
    • Ice Cream Sandwich: Android 4.0.3+ (MR1 or later), which is API level 15
    • Jelly Bean: Android 4.1+ (release, MR1, MR2 or later), which are API levels 16, 17 and 18
  • you can run the app on an Android emulator if:
    • the emulator is set to use the host GPU
    • the emulator is running Ice Cream Sandwich (MR1 or later) or Jelly Bean (release or later)
    • the emulator is not running in a Virtual Machine

These requirements appear here and there in the documentation, mostly concurring with itself: 1, 2, 3. [Update: the 3rd link is new and also lists various devices that FireMonkey apps have been tested on]

[Edit: It should be noted that the Android emulator is an *emulator* – it emulates ARM instructions when set up as an ARM emulated device. This is in contrast to the iOS simulator, which simulates an iOS device by running an Intel code version of the app, where the real iOS app again will be built with ARM instructions for the iOS device ARM chip. The implication of this is that the performance is atrocious and extremely disappointing for most. As Warren Postma details in XE5 Trial Download and Install Experience, you would really be advised to get a cheap Android tablet to test on, and use the emulator as a last resort.]

[Edit: I should add that if you are going to get a cheap Android device to test your apps then you should most definitely take steps to ensure it meets the minimum specifications required by a Delphi application – it must have an ARMv7 chip that supports NEON instructions and be running an appropriate OS version. Thanks for the reminder on that, Jolyon]

How do you find out if your device is supported? Well, the OS version you can find out in the Settings. The path and menu items may vary but goes roughly like this: Settings, About phone (or tablet), Software information, Android version.

To check the CPU details you’ll need to run one of the tools from the Android SDK against your connected device. Delphi installs the Android SDK and NDK if you don’t tell it you have it pre-installed. The Android SDK gets installed into a directory something like: C:\Users\Public\Documents\RAD Studio\12.0\PlatformSDKs\adt-bundle-windows-x86-20130522\sdk. In the platform-tools subdirectory from there is the Android Debug Bridge, adb.exe.

To run a command against your device it needs to be connected, typically by USB. This requires you to install an appropriate USB driver for your device as the ones located by Windows typically don’t do the job. Refer to the helpful The Delphi Geek blog post on the matter, XE5 and USB Drivers, for more information and links to drivers for the more common Android phone manufacturers.

When your phone is connected you’ll need to launch a command prompt and run an adb command. This may be easiest if you change directory to the platform-tools subdirectory (or Shift+right-click on the platform-tools folder in Windows Explorer and choose Open command window here). Firstly run the command:

adb devices

just to prove that your device can be seen by the Android tool chain. Assuming it can, run:

adb -d shell cat /proc/cpuinfo

This will show you CPU information something like this:

Processor       : ARMv7 Processor rev 0 (v7l)
processor       : 0
BogoMIPS        : 13.52

processor       : 1
BogoMIPS        : 13.52

processor       : 2
BogoMIPS        : 13.52

processor       : 3
BogoMIPS        : 13.52

Features        : swp half thumb fastmult vfp edsp thumbee neon vfpv3 tls vfpv4

CPU implementer : 0x51
CPU architecture: 7
CPU variant     : 0x1
CPU part        : 0x06f
CPU revision    : 0

Hardware        : UNKNOWN
Revision        : 0003
Serial          : 0000000000000000

Check the Processor line to ensure you are running ARMv7. In the Features line check that neon is included in the CPU feature list

Product Launch

There have been various events worldwide over recent fays and more coming in the days ahead, spreading the word about the new Android support in Delphi XE5. Today I attended the London event, which was held in a theatre in the Natural History Museum.

NHM

Embarcadero’s JT was over to help with the launch, and also on stage were Jason Vokes and Steve Ball.

I was a long way back in the audience with the zoom on my telephone’s camera on maximum. But this was the theme for the day.

Delphi.Android

Addenda

If you are keen to try out Delphi’s Android support, go right ahead and start downloading and installing. However I would urge you to read up on how Android development works whilst the download/install process takes place. There are many docwiki pages that help you get a handle on how it all fits together with the main entry point here: Android Mobile Application Development. A whole bunch of subtopics are listed here.

Recent posts about Delphi’s Android support, which pre-dated today’s launch, include the following:

In a previous blog post I discussed the Objective-C Bridge, available when building iOS apps. This is part of the RTL that allows Delphi code to interact with Objective-C API code. Objective-C code is compiled native code and Delphi code is compiled native code, so the bridge allows the two sets of code to get along. You can define Delphi versions of iOS classes (rather akin to how you can declare Delphi versions of Win32 API functions in classic Delphi), create instances of Objective-C classes, inherit from Objective-C classes and generally do what is necessary to access parts of the CocoaTouch API that are not consumed and surfaced by FireMonkey or parts of the API that do not have similar behaviour exposed by FireMonkey.

Oh, I should mention it’s not so much called FireMonkey now. It seems to be getting referred to more and more as the FM Application Platform. I suspect the latter sounds a little more “business”-y.

Anyway, the Android support offers a similar API bridge called the Java Bridge. Now the Android SDK classes are Java classes living in the world of the Dalvik VM. Delphi code is machine code running on the CPU. This is different to the iOS case. So the Java Bridge uses JNI to communicate across the native/managed boundary but basically offers broadly similar behaviour. You can declare Delphi versions of Android classes, create instances of them and communicate with them. So aspects of the Android API that do not get employed by regular Delphi apps can be accessed for the most part.

One shortcoming of the Java Bridge is that you cannot inherit from a Java class, which makes certain things rather tricky. However I’m going to write up my understanding of the Java Bridge and Objective-C Bridge in additional fuller articles with various examples over coming months, and try and offer ways around the Java Bridge shortcomings. Watch this space. Well, ok, you’d do better to read up on all the Android backgrounders in docwiki while downloading and installing XE5 :o)

Here are some more Embo pages for you to chew over and apply due consideration to:

Delphi Android dude

Monday, 10 June 2013

10 Tips For Delphi Users

Working on some Delphi projects with some clients over recent weeks has thrown up a number of tips that have been well-received so I thought I’d write them up for a more global audience.

1) Running apps from network shares

Sometimes people like to put executables on network drives and run them from there – it allows potentially many users to launch a single executable. However if the program is running and the network connection breaks there is a more than reasonable chance that the program will crash is a quite ghastly manner, understandably enough.

Given users are at liberty to launch there apps like this it may be an idea to make habit a simple step that alleviates the aforementioned crash scenario. You can have the Delphi linker set a special bit in a 32-bit Windows executable header to instruct Windows that in the event of being launched off a network drive the executable should first be copied to the local paging file and then be launched from there. This flag was introduced in Windows NT 4.0 and described in this old MSJ article by Matt Pietrek from 1996.

This is quite straightforward. You can do this with a compiler directive in the project file or you can change the linker setting (at least in recent versions of Delphi).

To change the project file, you must make sure that Windows (or Winapi.Windows, if you prefer) is in the uses clause and then add in this compiler directive after the uses clause:

{$SetPEFlags IMAGE_FILE_NET_RUN_FROM_SWAP}

To set the linker option directly, open the project options dialog (Ctrl+Shift+F11), go to the Linking options, ensure you are looking at options for a 32-bit build configuration and then give a value of 2048 to the Set extra PE Header flags option. This is passed along to the compiler as the --peflags:2048 command-line switch and does the same thing.

You could work out the value to pass along yourself by looking in Winapi.Windows.pas and seeing that IMAGE_FILE_NET_RUN_FROM_SWAP has a value of $800, which in decimal in 2048.

Update: Just to clarify some points that have come up in comments, this linker setting does not affect operation of the program in terms of how .ini files shipped alongside the .exe get loaded or what the value is returned by Application.ExeName.

2) Inspecting an item in a TList

The old TList class is still a useful beast, even if in many cases we should be using the newer generic TList<T>. TList is useful when the list will potentially contain objects of different types, with suitable backup code that knows to check the type and cast appropriately.

In the debugger, if you want to inspect an item in a TList things can be a bit of a challenge. When you inspect your TList variable (Alt+F5) you get a debug inspector that hints at the items contained therein in its FList field.

TList1

If you right-click on FList and choose Descend (or Ctrl+D, to make this inspector inspect that field) or Inspect (or Ctrl+I, to launch a new inspector showing that field) you’ll see the addresses of the items in the list.

TList2

These aren’t much use though; being as this is the type-unsafe general TList these values are just pointers. Indeed if you look in the definition of TList you’ll see this FList field is a TPointerList – an array of pointers.

So what do we do to inspect the item underlying a pointer variable? Well, we cast the pointer to the right type and inspect that. To work out what type that is, add a watch that casts the address shown in the inspector to a TObject and call its ClassName method – don’t forget to ensure the watch is set to allow side effects and function calls when adding it.

TList3

This tells you the type. Now you can bring up an inspector for the currently unhelpful point by selecting it in the inspector and pressing Ctrl+I, or maybe just double-clicking it.

TList4

Then you can apply the typecast by right-clicking and choosing Type Cast... or pressing Ctrl+T, and entering the target type of TFoo (in this example’s case). And then you have what you sought:
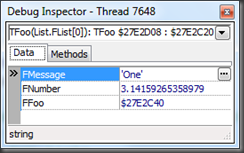
TList5

For bonus points you can identify the target type in the CPU window’s memory pane rather than the watch window. Invoke the CPU window with Ctrl+Alt+C and pay attention just to the memory pane at the bottom left. In recent IDEs you can also just invoke a solitary memory pane using View, Debug Windows, CPU Windows, Memory 1 (Ctrl+Alt+E) or Memory 2 (Ctrl+Alt+2) or Memory 3 (Ctrl+Alt+3) or Memory 4 (Ctrl+Alt+4).

In the memory pane, firstly have the memory displayed in 8 byte chunks of data by right-clicking and choosing Display As, DWords.

Now right-click again and choose Go to address… (Ctrl+G) and enter a suitable expression based on the pointer value. In the case above the first pointer in the list had the value $27E2C20. This is an object reference – the address of an object’s instance data. So if we de-reference the pointer we’ll be at the start of the instance data. But the address of the class name string is a little way into the instance data, a distance given by the constant vmtClassName, so the required expression will be:

PInteger($27E2C20)^+vmtClassName

TList6

As mentioned, we’re now looking at the address of the class name, which is stored as a short string. To follow (de-reference) this address, right-click on it and choose Follow, Offset to Data or press Ctrl+D. This takes us to the information we seek: TFoo.

TList7

If you wish you can change the display back to bytes (right click, Display As, Bytes) and then the short string is more obvious – you can see the length prefix byte for the 4 character string is indeed 4.

TList8

3) Loop failure iteration detection

You’ve doubtless encountered this scenario while debugging. There’s an issue in a loop. The loop executes *loads* of times but you need to look into the problem so you need to know how many times round the loop the problem occurs. Stepping through the loop, or using a breakpoint and pressing F9 or clicking on the last line of the loop and pressing F4, counting in your head – all such options are mind-numbing and hugely prone to losing count or messing up in some regard, so how about letting the system work it out for you?

Place a breakpoint at the end of the loop with a massive pass count – say 1000000. Now run the app and make the problem occur. Now look in the breakpoints window and check the current pass count – it will tell you how many times the breakpoint has been passed without actually breaking.

Once you know how many iterations it has been through, modify the properties of the breakpoint and set the pass count to that value. Restart the program and the when the breakpoint triggers the error will occur on the next iteration of the loop. Nice!

4) Breakpoint logging

Breakpoints had their advanced properties added many, many versions ago. You can use advanced breakpoint properties for a variety of cunning debugging scenarios, but a simple usage is to enable cheap logging without writing additional code statements.

Wherever you want to log some information, add a breakpoint and bring up the breakpoint properties. Press the Advanced button, set the breakpoint to not actually break and then specify the log message. For bonus points you can also choose to have an expression evaluated and (optionally) logged at the same time.
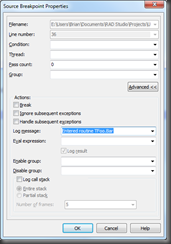
AdvancedBreakpoints

This log information will be added to the Event Log window during your debug session in the same way that OutputDebugString messages are, but with the benefit of not having written any code. If you have the IDE set to save your project desktop then the breakpoints will be saved when you close the project and reappear next time you open it.

5) Leaving RTL assembler code

When stepping through code with Debug DCUs enabled you often inadvertently end up in RTL assembly code. In most instances Shift+F8 (Run, Run Until Return) will run the rest of the code through and take you back to where you were so you can try F7 again.

Shift+F8 doesn’t always work. For example if you use F7 on a call to a dynamic method you end up in the System unit’s _CallDynaInst routine. This doesn’t exit in the normal manner, but by jumping off to the located method address stored in the ESI register.
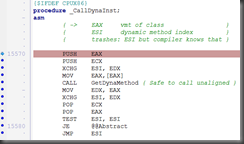
CallDynaInst

The best way forward here is to click on the JMP ESI line, press F4 to run up to that point and then press F7 – that will take you into the dynamic method that was called.

6) Find declaration while debugging

Seasoned Delphi developers know that you can locate the definition of a symbol by right-clicking it in the editor and choosing Find Declaration. Rather annoyingly there is no shortcut listed next to it, but it is commonly known that if you hold down Ctrl and wave your mouse around the editor, anything that the IDE thinks it can locate the definition/declaration of turns into a hyperlink – this Ctrl+click hyperlink feature is Code Browsing and links to the Code Browsing History keystrokes of Alt+← and Alt+→ that allow you to go back and forth though the links you’ve clicked.

The problem with Ctrl+click is that it doesn’t work in a debug session. Many times it would be handy to find the definition of a symbol in a debug session but Ctrl+click just doesn’t cut it. Fortunately, however, Alt+↑ *does* work in a debug session (yay!)… (or at least should do – it generally does for me). Why Alt+↑ isn’t listed in the editor context menu against Find Declaration baffles me. It’s a very little-known but useful shortcut.

7) Non-destructively locally disable a compiler option

Often-times a build configuration has range-checking enabled to ensure problems show up when they occur as tangible issues rather than vague Access Violations through memory overwrites way down the line during an execution. That said, it can still be important to selectively turn off range-checking for specific small sections of code that are valid, but will flag up range-check errors thanks to, say, the pointer types involved.

Clearly you can turn range-checking (or overflow-checking or whatever) off and on using local compiler directives, as in:

{$R-}
//code that requires range-checking off
{$R+}

but what about if you then build the code with a build configuration that has range-checking globally disabled? This use of compiler directives means the file in question will have range-checking *enabled* from that point onwards, despite the intent being to have it disabled throughout the project.

This is where this tip comes in. You can selectively change a compiler option using code like this, where this example disables range-checking if it was enabled, and then ensures it gets enabled again if appropriate:

{$IFOPT R+}
  {$DEFINE RANGE_CHECKING_WAS_ON}
  {$R-}
{$ENDIF}
//code that requires range-checking to be disabled
{$IFDEF RANGE_CHECKING_WAS_ON}
  {$R+}
{$ENDIF}

Here we define a conditional symbol if we toggle range-checking off, and we use that symbol’s existence to decide whether to enable range-checking later.

8) Building a Delphi project at the command-line

For quite a few versions now, Delphi has used the MSBuild format for its project files and project group files. This means you can use MSBuild to build your projects and project groups, using appropriate MSBuild command-lines to pass in options or specify build targets (the targets include clean, make and build). So if you have a project Foo.dproj and you want to clean up the previously produced binaries (compiled units and executable output) and then build it in Release and Debug configurations for Win32 and Win64 you could run these commands in a RAD Studio Command Prompt:

msbuild -t:clean -p:Config=Debug -p:Platform=Win32 Foo.dproj
msbuild -t:build -p:Config=Debug -p:Platform=Win32 Foo.dproj
msbuild -t:clean -p:Config=Release -p:Platform=Win32 Foo.dproj
msbuild -t:build -p:Config=Release -p:Platform=Win32 Foo.dproj
msbuild -t:clean -p:Config=Debug -p:Platform=Win64 Foo.dproj
msbuild -t:build -p:Config=Debug -p:Platform=Win64 Foo.dproj
msbuild -t:clean -p:Config=Release -p:Platform=Win64 Foo.dproj
msbuild -t:build -p:Config=Release -p:Platform=Win64 Foo.dproj

9) Formatting entire projects

Recent versions of Delphi have offered pretty printing, as it used to be called, or source formatting as the process is now described. It’s invoked by Edit, Format Source (or Ctrl+D) and can be fully customised in the Tools, Options dialog. Your custom settings can be saved into formatter profile files.

It’s less well known that the formatter is also available through a command-line tool. You can use this to run it across all files in a project directory tree.

Assuming you’ve saved your custom IDE formatter options in a formatter profile called Formatter_MyProfile.config then you start by running up a RAD Studio Command Prompt. Now issue some commands along these lines and it’s all done for you:

set CONFIG="Formatter_MyProfile.config"
set LOG=Format.log
del %LOG%
formatter -delphi -config %CONFIG% -r –d . > %LOG%

10) Case toggle

If you are not a touch typist and occasionally type a whole bunch of code in with CAPS LOCK on you should become familiar with the keystroke that toggles the case of a marked block: Ctrl+O, U.

11) Bonus tip: disable Error Insight to lower blood pressure

I’ve said this before in talks and in writing. I’m very happy to say it again. Please, *please*, don’t suffer the shame of Error Insight and its hopeless and hapless efforts in working out what might compile and what might not. Yes, it gets the simple ones right. But any vaguely interesting project that you work within is pretty much guaranteed to be besmirched with lots of red squiggles over perfectly good code and perfectly locatable units in the uses clause all within a fully compilable code base. The fact that Error Insight continues to be enabled by default, despite the growing problem of its inaccurate problem detection is really rather surprising. I urge you to disable Error Insight by going to Tools, Options… and then locating the Code Insight options within the Editor Options.

Yes, yes, there are reasons why it gets it wrong – it’s not using the exact same code as the compiler does and doesn’t know all the things that the compiler does. But this has been the case for years, and it still offends my eyes with its tenacity of squiggling over code that has just compiled cleanly.

Ease your annoyance at Error Insight by turning it off. Then pick any of the plethora of Error Insight bugs logged on QC and vote for it/them.

Seriously though, on very large projects, disabling anything that executes and isn’t useful/productive is a benefit. When working with clients’ large projects I disable Error Insight, Tooltip Help Insight and automatic Code Completion.